
Kanban Board: Find Bottlenecks and Manage Workload
A project manager opens a project Kanban board and sees that tasks are distributed unevenly across the workflow. One stage has relatively few tasks, while another has accumulated many more. This does not necessarily indicate a problem. To understand what is happening in the process, it is important to look at the amount of work in progress, how it changes over time and what that work consists of.
When tasks start to accumulate, the manager needs to understand why. The team may have taken on too much work, one stage may be limiting further progress, tasks may depend on a particular resource, or a significant amount of work may be returning to earlier stages.
A Kanban board makes it possible to analyse these patterns directly through the work being done.
Work Distribution
Kanban board columns represent the stages of a workflow. The distribution of tasks across these columns gives the manager an initial view of the state of the process.
The concept of WIP (Work in Progress) describes the amount of unfinished work currently within the process. WIP itself is not a problem. Every team has a certain amount of work in progress. What matters is how this volume changes and how quickly tasks move towards completion.
If a team completes work at roughly the same rate as it starts new work, the amount of WIP remains relatively stable. If new tasks arrive faster than the team can complete them, WIP increases. As it grows, more tasks require attention, wait for the next action or depend on other team members.
When Work in Progress Becomes a Queue
Ten tasks in a column do not necessarily constitute a queue. A queue forms when work accumulates faster than a stage can process it.
Suppose there were eight tasks at a particular stage at the beginning of a period. Then there were twelve, followed by fifteen. The number of unfinished tasks is increasing, which means work is entering the stage faster than it is leaving it.
If the number of tasks remains at roughly the same level, that amount of WIP may be consistent with the normal throughput of the process.
This is why analysing how work distribution changes over time is important. The trend helps distinguish normal WIP from sustained accumulation.
Accumulation shows where a constraint may be forming. The next question is what is causing it.
Task Counts Show Accumulation, but Metrics Show Its Scale
The number of task cards does not always reflect the actual amount of work. Two columns may each contain ten tasks, but the overall workload can be very different. One may contain small work items, while the other consists of larger tasks with higher estimates.
In Weenvo, the following metrics can be used to assess task volume:
— Story Point;
— Estimate;
— Spent;
— Remaining.
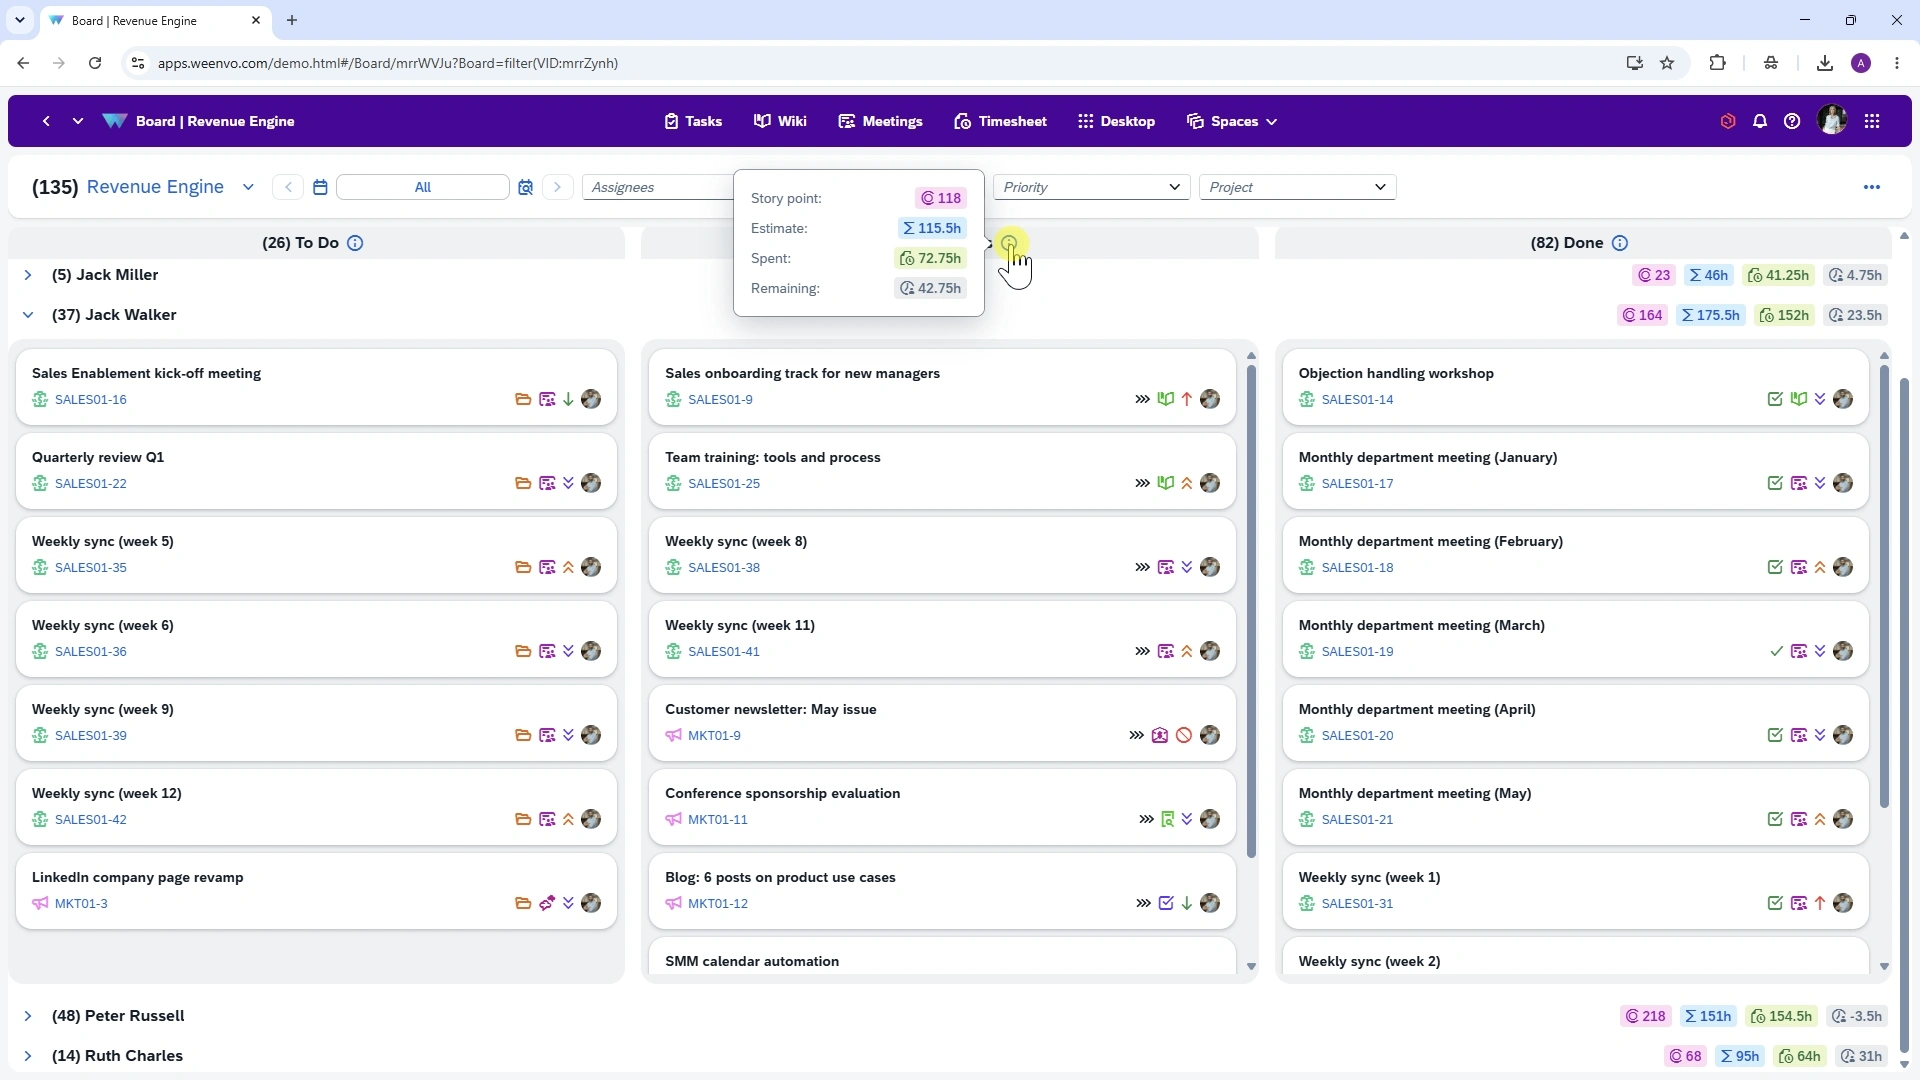
These metrics add more context to the picture provided by the distribution of tasks across columns.
If one stage has fewer tasks but their combined estimates are significantly higher, that stage may be creating more pressure on the process. When analysing WIP, it is therefore useful to consider both the number of work items and the amount of work they represent.
How to Understand What Is Causing the Accumulation
Suppose unfinished work is accumulating at one stage of a project. The accumulation indicates where to look for a possible cause. The next question is what is creating that volume.
In Weenvo, grouping can help with this analysis. Columns show the stages of the workflow, while groups add a second dimension to the view.
For example, a manager can open a project and group tasks by assignee. This shows not only how tasks are distributed across workflow stages, but also how much work is concentrated with particular team members.
If a significant share of unfinished tasks is assigned to one person, it is worth looking more closely:
— how much work they have;
— which stages their tasks are in;
— which tasks have a high priority;
— whether they depend on other team members;
— whether completing these tasks affects the further progress of the project.
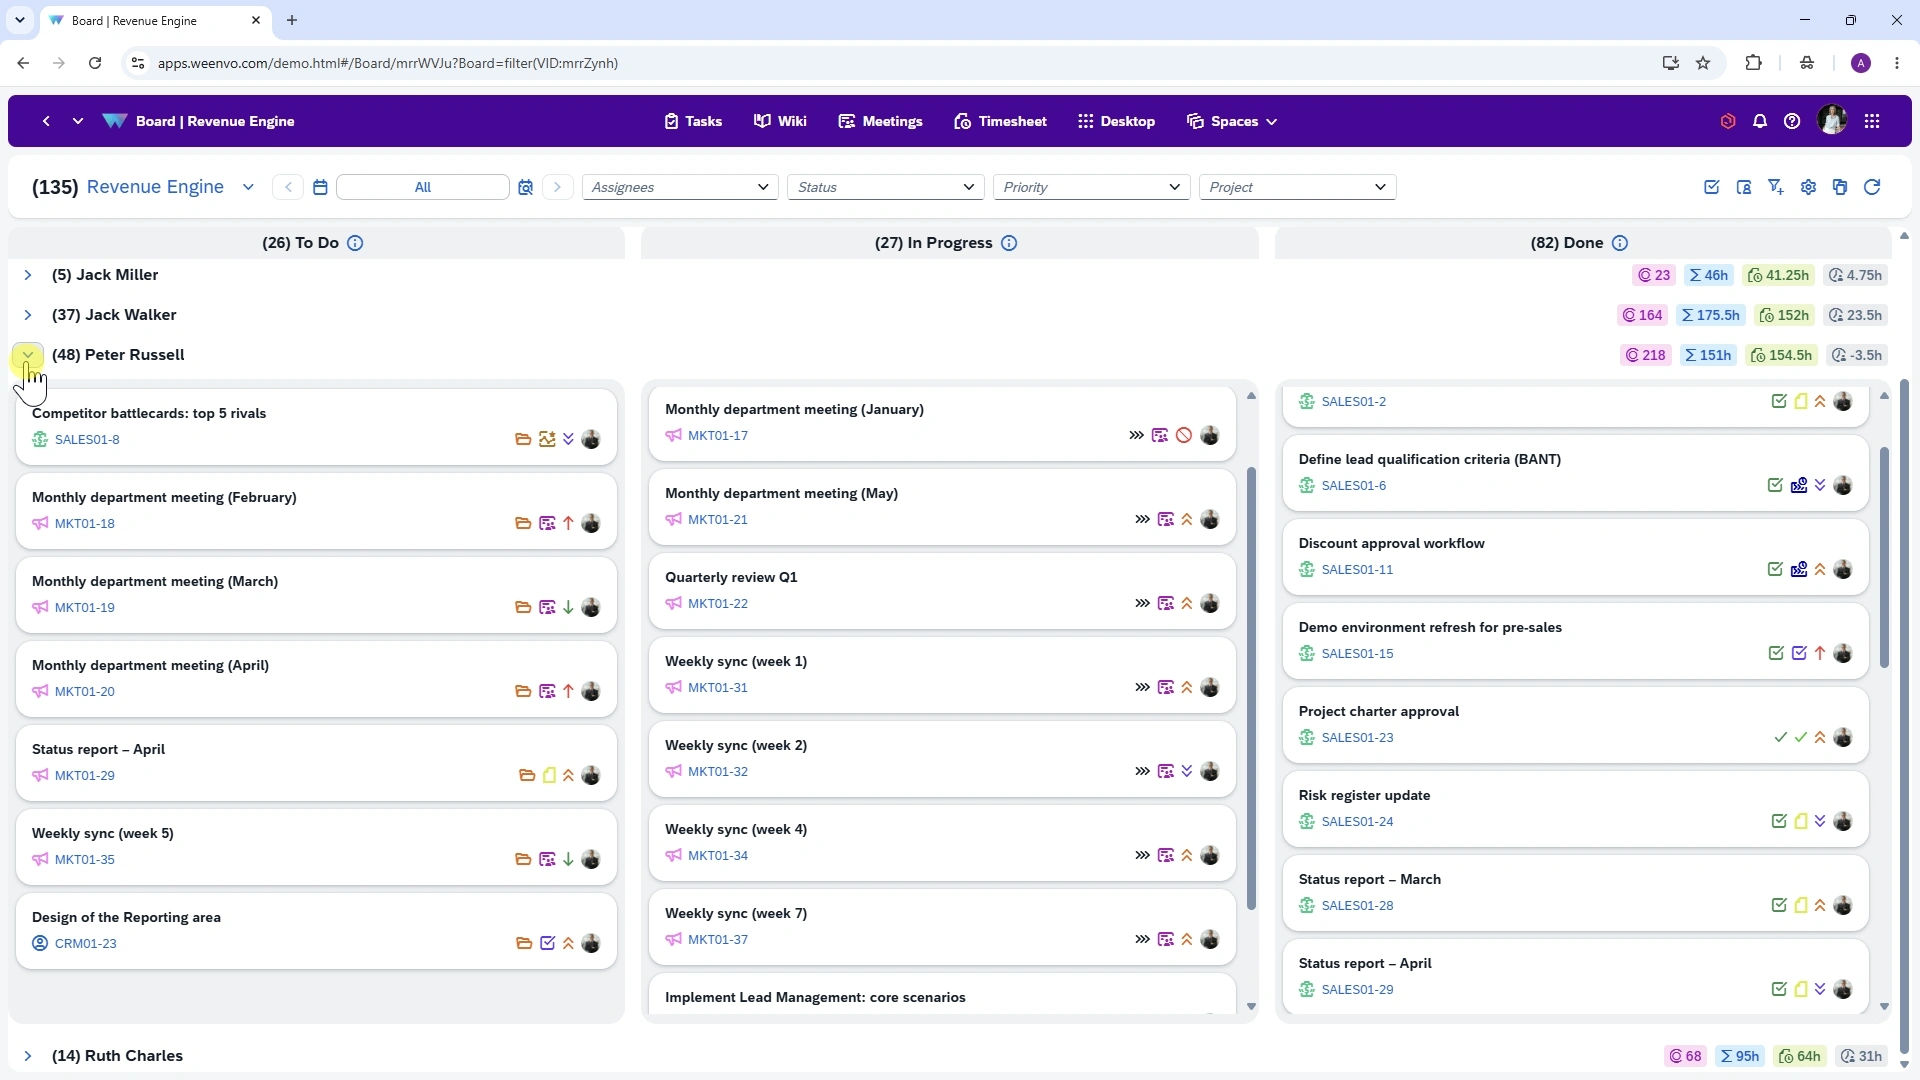
A large number of tasks assigned to one person does not necessarily mean that they are the constraint. Tasks may be waiting for an external decision or may be in a status that does not require active work from that person.
The opposite situation is also possible. A team member may have only a few tasks, but they may be large, critical to the project and necessary for work to progress further. In this case, the manager can see not just a concentration of tasks, but a dependency on a particular resource.
The same set of tasks can also be grouped by priority, type, component, label and other attributes. This provides additional views for analysing the current workload.
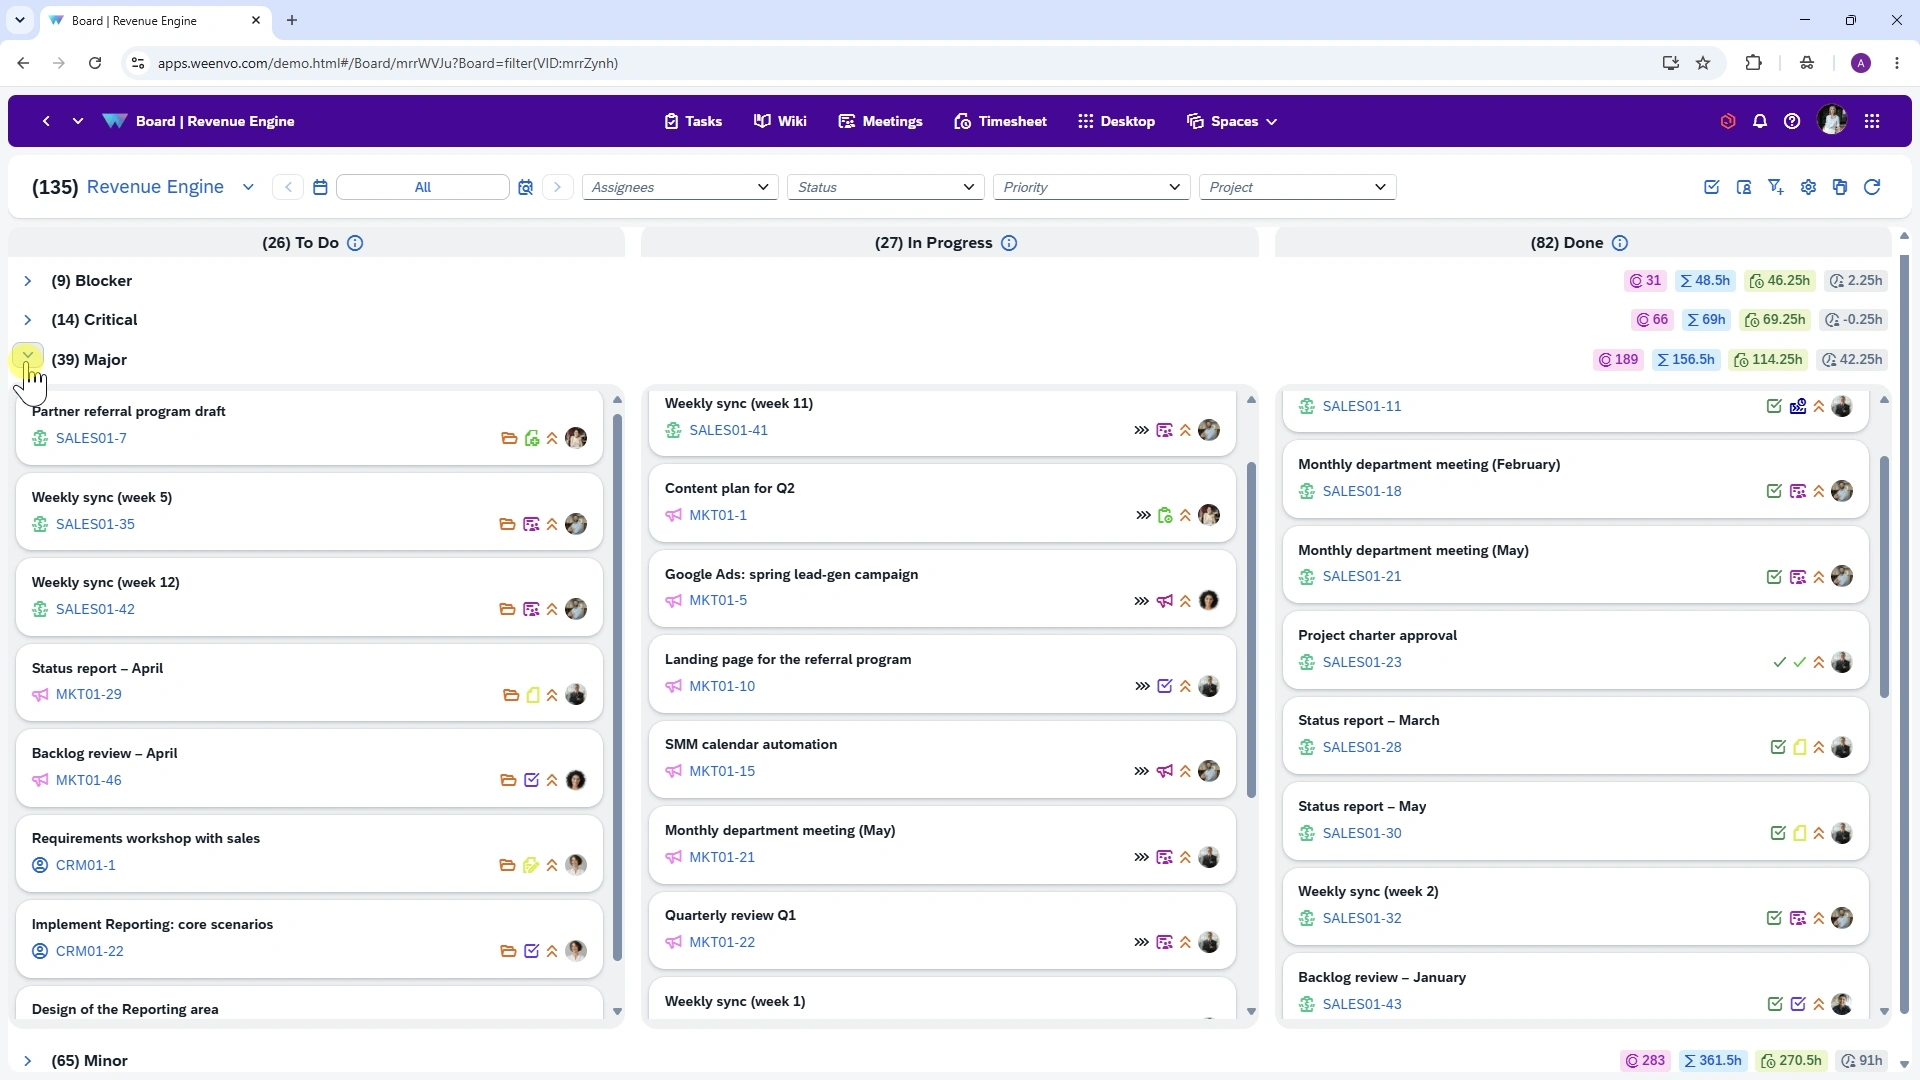
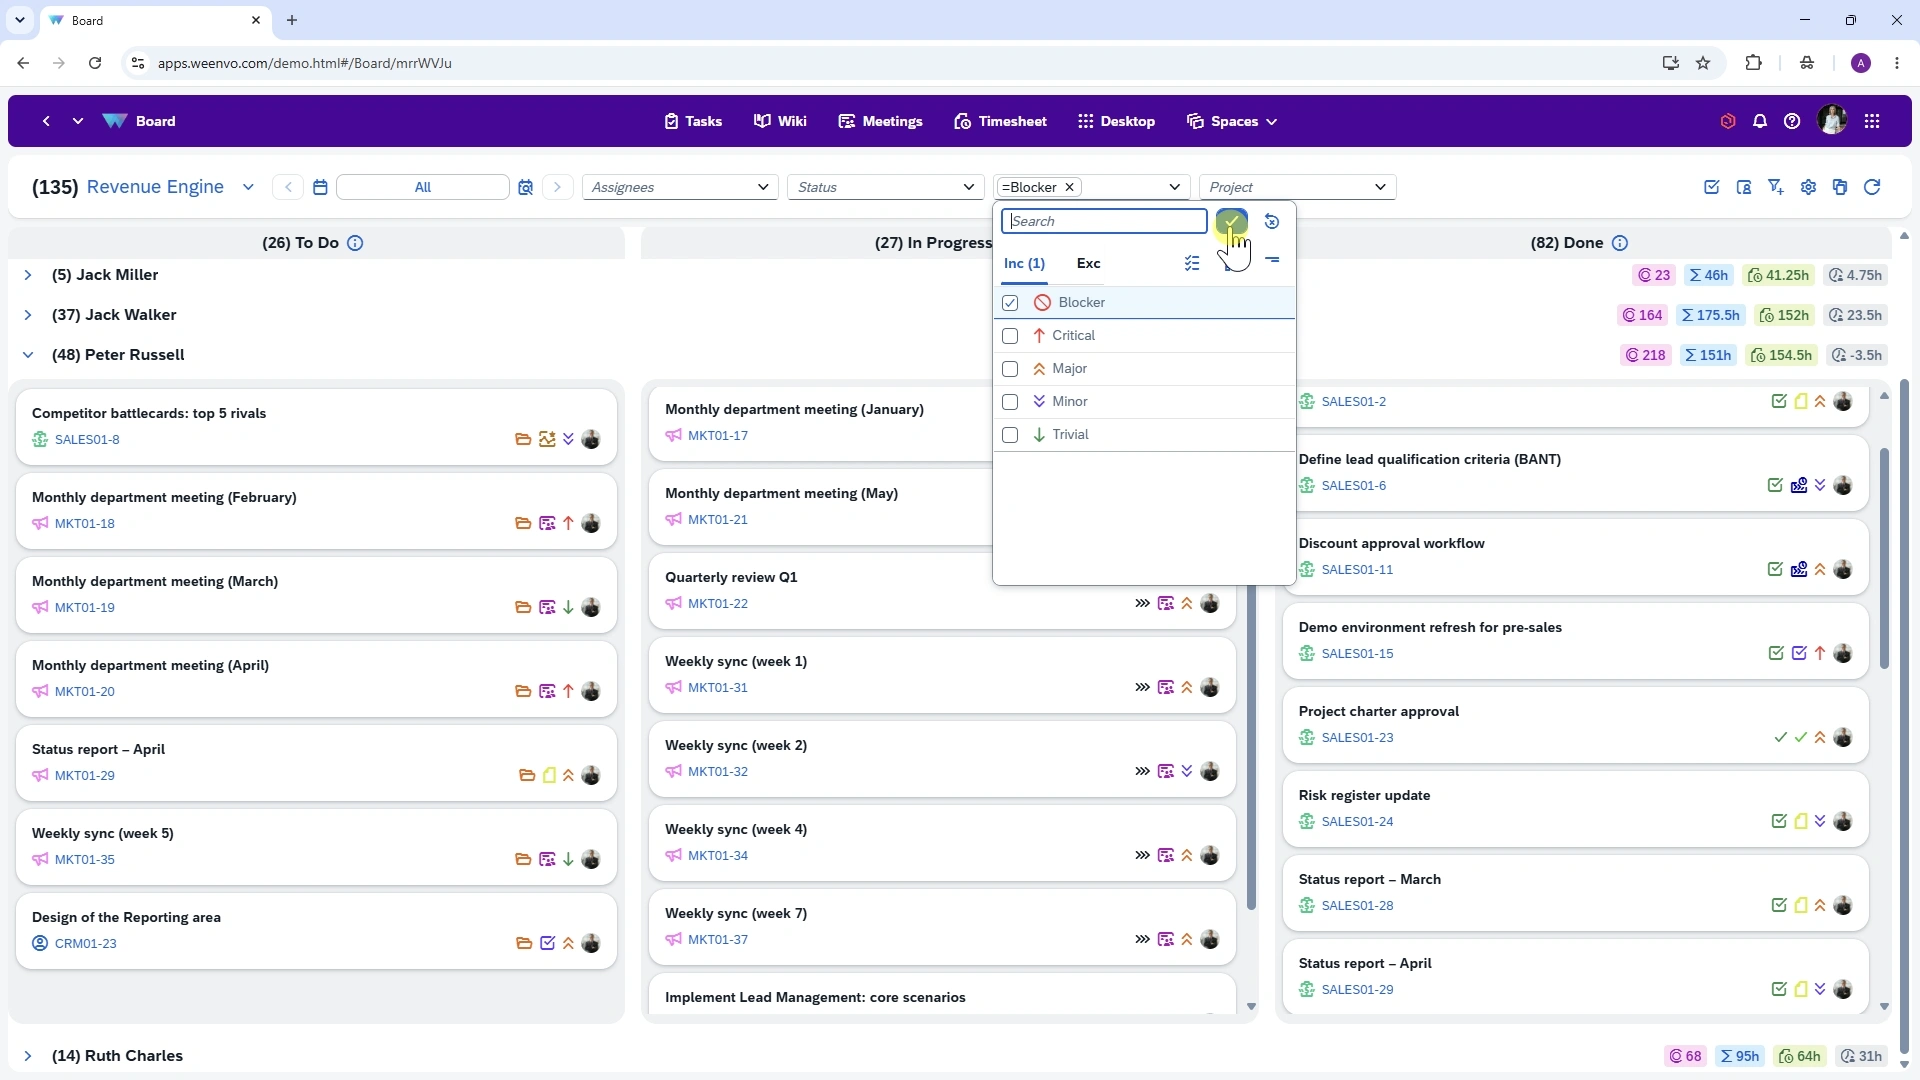
Grouping therefore helps move from the question “Where has work accumulated?” to a more precise one: “What is causing the accumulation and affecting the flow of work?”
How to Identify a Bottleneck
A bottleneck is a stage of a process that limits the rate at which work can move forward. A Kanban board does not show a bottleneck as a separate indicator. Instead, the manager identifies a potential constraint based on several signals.
Reasons to investigate include:
— sustained growth in unfinished work at one stage;
— tasks remaining at that stage for an extended period;
— incoming work exceeding the stage’s processing capacity;
— work repeatedly moving back to previous stages;
— a significant amount of work depending on a single resource;
— delays affecting subsequent stages.
A full column alone is not proof of a bottleneck. A constraint becomes apparent through the behaviour of the flow: work enters a stage faster than the process can move it forward.
What to Do After Identifying a Bottleneck
Once a bottleneck has been identified, the next step is to determine what is causing the accumulation and decide how to address the process.
If the bottleneck is related to a particular resource, work may need to be redistributed. If tasks are too large, they may need to be broken down into smaller work items. If work regularly returns to a previous stage, the underlying cause of the rework needs to be addressed.
Other options include:
— limiting incoming work;
— changing the order of priorities;
— redistributing activities;
— removing unnecessary approval steps;
— automating repetitive actions;
— increasing the processing capacity of the stage.
Not every bottleneck needs to be accelerated. First, it is important to understand what is actually limiting the flow and how changing that part of the process will affect the other stages.
Look at the Flow Again After Making a Change
Any process change can be evaluated by looking at how the distribution of work changes afterwards.
The manager can check whether:
— the accumulated workload has decreased;
— WIP has stabilised;
— tasks move forward more quickly;
— work has become more or less concentrated among team members;
— a new constraint has appeared at another stage.
If the previous queue decreases and tasks move through the process faster, the change has had the expected effect. If the accumulation has simply moved further along the workflow, the process has encountered another constraint. This is a normal part of working with complex processes. Removing one constraint can make another one visible.
A Kanban board in Weenvo allows managers to examine a workflow at the level they need: see how tasks are distributed across stages, assess the amount of unfinished work, change the view using grouping, and compare tasks with their estimates and time spent. This provides a basis for decisions about resource allocation, priorities and process changes.
See how the Kanban board works in Weenvo: open the demo or start for free.